


Economic Highlights
The Canadian economy has struggled to grow in recent years, and 2025 brought the additional challenge of US tariffs. Preliminary estimates suggest that the economy grew slightly over 1.5%, though performance varied across sectors. Growth was supported in large part by the Canada-US-Mexico Agreement (CUSMA), which continued to allow tariff-free trade for most goods that met its rules. Steel, aluminum and lumber remained notable exceptions, facing separate and steep US tariffs.
Canadian exporters have done their best to reduce exposure to tariffs. Canada’s exports to non-US countries hit a record high in October, helped by foreign demand for precious metals. The federal government has made trade diversification a top priority, which should help other sectors gradually reduce their reliance on US markets over time.
At home, consumer spending also grew modestly. Trade uncertainty and tariff risks have encouraged Canadians to shop locally; in a Bank of Canada survey, 60% of Canadians stated an intention to buy Canadian goods over American ones.
The labour market showed mixed results. The number of Canadians employed increased slightly during the year, but not as quickly as the number of people seeking work. As a result, the unemployment rate ended the year 0.1% higher than it started. The good news is that even the industries directly affected by US tariffs have not yet seen major job losses, although that remains a risk for 2026.
Inflation fluctuated during the year and finished at 2.4%. Several government policies helped to reduce price pressures in the first half of the year, such as the HST/GST holiday that started in 2024, as well as the removal of consumer carbon pricing. However, other areas remained more challenging. Food prices rose 3.2% and housing costs increased 3.0%, although this was a significant slowdown from housing’s 5.7% increase in 2024.
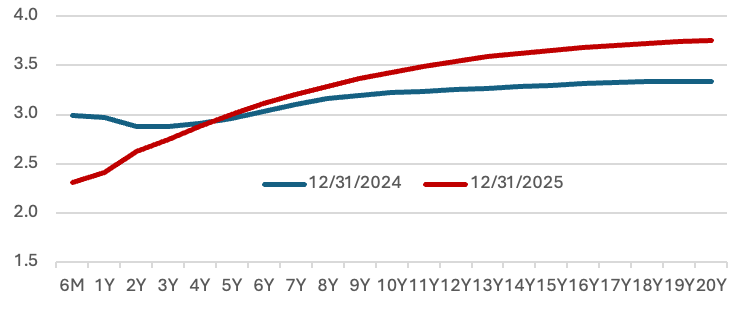
With slower economic growth and easing inflation, the BoC delivered four rate cuts in 2025, lowering the overnight rate from 3.25% to 2.25%. These cuts reduced short-term interest rates in bond markets as well. However, longer-term interest rates, which the BoC doesn’t control directly, moved higher on investors’ concerns that the Federal government may need to borrow more to support Canada’s economic adjustment, or that inflation could rise again:
Figure 1. Government of Canada Yield Curve, Dec. 31, 2024 to Dec. 31, 2025 (%)
Source: Bloomberg
Canada was not alone in this – longer-term interest rates moved higher in 2025 in most major bond markets around the world. Investors increasingly expect that a more fragmented and crisis-prone global environment will force governments to borrow and spend more on everything from defense to health care and social assistance.
Market Highlights
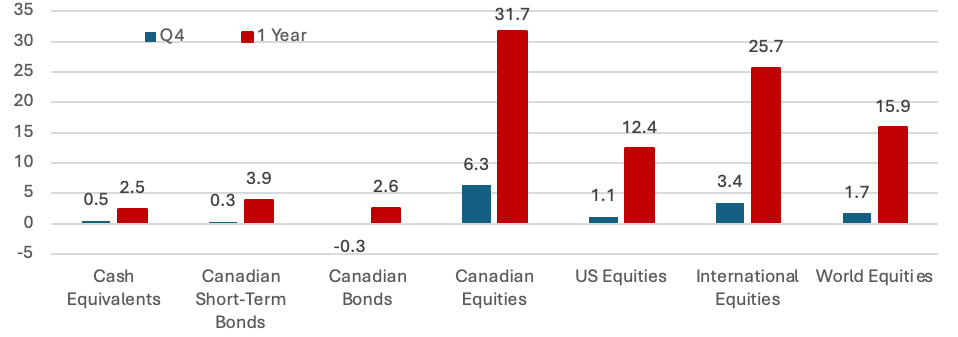
All major asset classes delivered solid returns for the year:
Figure 2. 2025 Returns from Key Asset Classes (in Canadian dollars)
Source: eVestment
It was a good year for equities, as companies around the world grew their profits, despite uncertain trade policies and a mixed economic outlook. While technology and AI-related companies led performance in the first three quarters, Q4 brought broad participation across sectors, including financial and resource companies – which boosted Canadian markets.
In fixed income, short-term bonds did better than the broad Canadian “Universe” bond index in Q4 and for the full year. The Universe index includes most of the major bonds in the Canadian market. This outperformance was due mainly to interest rate movements. Short-term rates fell, supporting short-term bond prices, while rising long-term rates reduced the value of longer-term bonds.
Encasa Fund Results (%, as at December 31, 2025)1
| Q42 | 1 Year2 | 3 Years3 | 5 Years3 | 10 Years3 | |
|---|---|---|---|---|---|
| Encasa Canadian Short-Term Bond Fund | 0.2 | 3.2 | 4.3 | 1.1 | 1.5 |
| FTSE Canada Short Term Overall Bond Index | 0.3 | 3.9 | 4.9 | 1.8 | 2.1 |
| Encasa Canadian Bond Fund | -0.4 | 2.1 | 4.1 | -1.1 | 1.3 |
| FTSE Canada Universe Bond Index | -0.3 | 2.6 | 4.5 | -0.4 | 1.9 |
| (4) Encasa Equity Fund | 4.6 | 22.3 | 23.0 | 13.6 | 11.0 |
| Benchmark | 3.3 | 21.3 | 22.0 | 15.0 | 12.4 |
Encasa Canadian Short-Term Bond Fund
The Short-Term Bond Fund delivered a return of 0.2% for the quarter, bringing the 1-year return to 3.2%. For comparison, the Fund’s benchmark, which doesn’t include fees or expenses, delivered a return of 0.3% for the quarter and 3.9% for the year.
In Q4, the Fund held more Corporate and Provincial bonds and fewer Federal bonds compared to the benchmark, with overall interest rate sensitivity close to the benchmark’s.
As at December 31, the Fund’s yield to maturity (expected return if bonds are held to maturity) was 3.1%, compared to 3.0% for the benchmark.
Reflecting Encasa’s commitment to Responsible Investment, 30.6% of the Fund’s portfolio was invested in Sustainable Labelled bonds (bonds that help fund environmentally or socially beneficial projects), compared to 4.9% for the benchmark. The Fund also had a lower carbon intensity, with carbon emissions relative to company revenues 68% lower than the benchmark5.
Encasa Canadian Bond Fund
The Canadian Bond Fund declined 0.4% in the quarter, bringing its one-year return to 2.1% after fees. The Fund’s benchmark, which doesn’t include fees, returned -0.3% for the quarter and 2.6% over the past 12 months.
During the quarter, the Fund invested more in Corporate and less in Federal bonds compared to the benchmark, with Provincial bonds roughly in line with the benchmark. The fund reduced its interest rate sensitivity during the quarter as the probability of lower interest rates declined. At the end of the quarter, the Fund’s yield to maturity was 3.7%, compared to 3.5% for the benchmark.
Consistent with Encasa’s commitment to Responsible Investment, 36.8% of the Fund’s portfolio was invested in Sustainable Labelled bonds, compared to 4.6% for the benchmark. The Fund’s carbon intensity was 54% less than the benchmark’s6.
Encasa Equity Fund
The Equity Fund rose by 4.6% in Q4, bringing its return for the one-year period to 22.3% after fees. The Fund’s benchmark, which doesn’t include fees, returned 3.3% for the quarter and 21.3% for the year.
The Fund focused on markets outside Canada in the quarter, allocating slightly more assets to those regions than the benchmark. Stock selection was the main source of added value in the quarter. While technology companies continued to perform well, the top contributors also included consumer stocks, gold companies and financial institutions.
At the end of Q4, the Fund continues to have slightly less exposure to Canada than its benchmark, and more exposure to the US and developed markets outside North America. The Fund continues to focus on companies with strong quality and growth characteristics.
Consistent with Encasa’s commitment to Responsible Investment, the Fund continues to avoid companies with controversial business practices or industries. The Fund’s carbon intensity, measured as carbon emissions relative to revenues of reporting companies in the portfolio, was 68% less than the benchmark7.
Concluding Note
2025 showed that markets can deliver solid returns even during periods of major disruptions and risks. As 2026 begins, uncertainty remains, including the possibility of further changes to US trade policy, the need to renegotiate CUSMA, ongoing geopolitical tensions and market valuations that already reflect optimistic expectations for corporate earnings, as well as AI-related growth.
As always, volatility is possible – and as always, the best way to manage that risk is to ensure that your portfolio is properly aligned with your objectives, time horizon, and comfort with market fluctuations.
If you have questions or concerns, please contact your Encasa advisor.
Endnotes
- Rates of return assume reinvestment of all distributions, after deduction of fees.
- Three-month and year-to-date rates of return are a simple return on investment (not annualized).
- Annualized returns.
- Prior to July 1, 2020, the benchmark for the Encasa Equity Fund was 70% S&P/TSX Composite Index and 30% MSCI World Ex-Canada Index.
- Based on portfolio’s estimated weighted average carbon intensity of 30.8 tCO2/$M revenue for reporting issuers, compared to 97.5 for benchmark.
- Based on portfolio’s estimated weighted average carbon intensity of 77.7 tCO2/$M revenue for reporting issuers, compared to 169.9 for benchmark.
- Based on portfolio’s estimated weighted average carbon intensity of 34.4 tCO2/$M revenue for reporting issuers, compared to 106.5 for benchmark.
Important Information
This material is provided for informational purposes only. It does not constitute investment, tax, financial, accounting, or legal advice, nor does it constitute an offer, solicitation, or recommendation to purchase or sell any security or to adopt any investment or portfolio strategy. The views and information presented do not take into account the investment objectives, financial situation, or needs of any specific person or organization. Investors should consult their advisors regarding their individual circumstances prior to making any investment decisions.
This document may contain forward‑looking information, including statements about expected economic or market conditions, interest rate trends, or potential future outcomes. Forward‑looking statements involve numerous risks, uncertainties, and assumptions, including changes in economic conditions, financial markets, interest and foreign exchange rates, regulatory or political developments, and other factors. Actual results may differ materially. Any forecasts, projections, or estimates are provided for general informational purposes only and should not be relied upon as guarantees of future events.
Information presented in this commentary has been obtained from sources believed to be reliable; however, Encasa Financial Inc. does not represent or warrant its accuracy, completeness, timeliness, or reliability. Encasa Financial Inc. is not responsible for any errors or omissions, nor for any loss or damage arising from reliance on this material.
All views, opinions, and estimates expressed reflect the author’s judgment as of the date of publication and are subject to change without notice as market and economic conditions evolve. This commentary was prepared solely by Encasa Financial Inc. No third party, including the Encasa Funds’ principal distributor, has reviewed, endorsed, influenced, or approved its content.
If performance data, illustrative scenarios, or model results are referenced in any accompanying materials, please note that past performance does not guarantee future results. Any examples, case studies, or hypothetical illustrations are for explanatory purposes only and may not reflect actual future outcomes.
Encasa Financial Inc. is a social purpose investment fund manager dedicated to supporting non‑profits, co‑operatives, and affordable housing providers by offering professional investment management grounded in community impact, long‑term stewardship, and responsible financial governance.